
November 2025 Jobs Report: The Latest Employment Trends

The latest job report for November provides a comprehensive overview of the current state of employment in the United States.
Federal Government Shutdown Impact
The lapse in federal appropriations (Oct 1 – Nov 12) affected both the household and establishment surveys:
Household Survey:
- October 2025 data were not collected and are unavailable.
- November estimates relied on adjusted statistical weighting due to the missing October data.
- Response rate for November was lower than normal (64.0%), contributing to higher standard errors.
Establishment Survey:
- October and November data collection periods were extended.
- October job data were published for the first time in this report and include detailed industry information typically reserved for later releases.
- Shutdown-related disruptions (e.g., furloughed federal workers) were accounted for; furloughed workers who received pay were considered employed.
While the exact impact of the shutdown is not quantifiable, the U.S. Bureau of Labor Statistics notes that the estimates are statistically valid and appropriately adjusted for the disruption.
November’s Key Findings
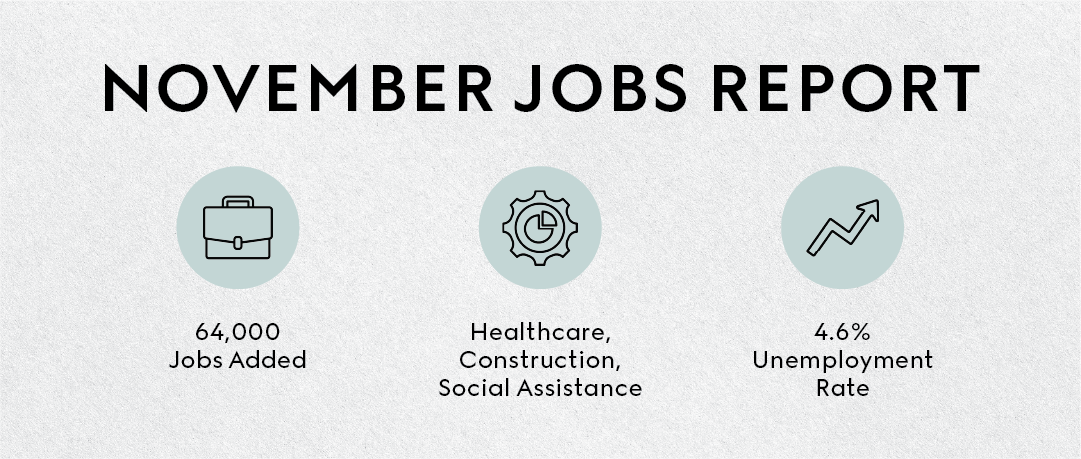
The U.S. Bureau of Labor Statistics reported that nonfarm payroll employment increased by 64,000 jobs in November, reflecting continued stagnation in job growth. Total employment has seen little net change since April. The unemployment rate rose slightly to 4.6%, with 7.8 million people unemployed - both figures higher than the same time last year.
Key sectors include:
- Healthcare
- Construction
- Social Assistance
Notable declines:
- Transportation & Warehousing
- Federal Government
Sector-Specific Employment Changes
While overall job growth remained subdued, several sectors showed movement in November, including gains in healthcare and construction, and ongoing losses in government and transportation.
Healthcare
Healthcare led job growth with an increase of 46,000 jobs, in line with the sector's 12-month average of 39,000 jobs. Job gains were distributed across: ambulatory health care services (+24,000), hospitals (+11,000), and nursing and residential care facilities (+11,000).
Construction
Construction added 28,000 jobs, driven primarily by growth in nonresidential specialty trade contractors (+19,000). This marks a notable uptick after a period of little change in construction employment over the past year.
Social Assistance
Social assistance employment rose by 18,000 jobs, continuing its upward trend. The majority of the increase came from individual and family services (+13,000), which has been a consistent source of growth in the public services sector.
Transportation & Warehousing
Employment declined by 18,000 jobs in this sector, entirely due to losses in couriers and messengers (-18,000). Transportation and warehousing have shed 78,000 jobs since peaking in February 2025.
Federal Government
Federal employment decreased by 6,000 jobs in November, following a sharp drop of 162,000 jobs in October. The decline reflects the exit of employees who had accepted deferred resignations during the shutdown. Since January, federal government jobs have declined by 271,000.
Other major industries including manufacturing, retail, information, finance, and leisure and hospitality, showed little or no employment change.
Unemployment Rates
The unemployment rate ticked up to 4.6%, rising from 4.2% one year ago. The number of unemployed individuals climbed to 7.8 million, up from 7.1 million in November 2024.
Unemployment rates by demographic group:
- Adult men: 4.1%
- Adult women: 4.1%
- Teenagers: 16.3%
- White population: 3.9%
- Black population: 8.3%
- Asian population: 3.6%
- Hispanic population: 5.0%
The number of individuals unemployed for less than 5 weeks rose to 2.5 million (+316,000). Long-term unemployment (27 weeks or more) remained stable at 1.9 million, accounting for 24.3% of all unemployed individuals.
Labor force participation & underemployment:
- Labor Force Participation Rate: 62.5% (unchanged from September)
- Employment-Population Ratio: 59.6% (unchanged from September)
- Employed part-time for economic reasons: 5.5 million (+909,000 from September)
- People not in the labor force but wanting a job: 6.1 million (little change)
Wage Growth & Average Workweek
Wage growth moderated in November, though earnings remain higher year-over-year:
- Average hourly earnings for all private nonfarm payroll employees increased by $0.05 (0.1%) to $36.86
- Over the past year, earnings have increased by 3.5%
- Private-sector production and nonsupervisory employees saw their wages rise by $0.11 (0.3%) to $31.76
The average workweek for all employees edged up by 0.1 hour to 34.3 hours. In manufacturing, average hours were stable at 40.0 hours, with 2.9 hours of overtime. For production and nonsupervisory employees, the workweek held steady at 33.7 hours.
Updates To Prior Months’ Employment Data
Revisions to employment figures for August and September revealed a downward adjustment:
- August 2025: Revised down by 22,000 jobs, from -4,000 to -26,000
- September 2025: Revised down by 11,000 jobs, from +119,000 to +108,000
These revisions reflect a net downward adjustment of 33,000 jobs. No revisions are reported for October due to its first-time publication this month.
For further reading, check out our other blogs on topics related to the job market.
Are you looking for top talent? Reach out to us today to get started.
Looking for your next career change? Explore our open jobs today.
Get the latest updates and exclusive content – subscribe to our newsletter!
Partner with Premier today.
Where in striving to do better, we transform lives in shared partnership with our exceptional employer and talent communities.
